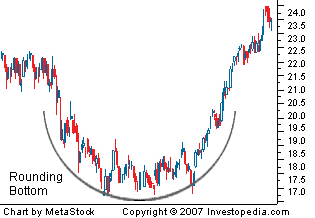
A chart pattern used in technical analysis, which is identified by a series of price movements that, when graphed, form the shape of a "U". Rounding bottoms are found at the end of extended downward trends and signify a reversal in long-term price movements. This pattern's time f
rame can vary from several weeks to several mo
nths and is deemed by many traders as a rare occurrence.
The chart below illustrates a rounding bottom.

A rounding bottoms look similar to the cup and handle pattern, but does not experience the temporary downward trend of the "handle" portion. The initial declining slope of a rounding bottom indicates an excess of supply, which forces the stock price down. The transfer to an upward trend occurs when buyers enter the market at a low price, which increases demand for the stock. o
nce the rounding bottom is complete, the stock breaks out and will co
ntinue in its new upward trend.

