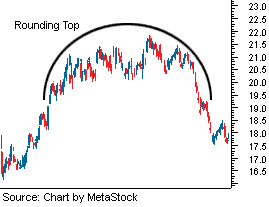
A chart pattern used in technical analysis which is identified by price movements that, when graphed, form the shape of an upside down "U". A rounding top may form at the end of an extended upward trend and indicates a reversal in the long-term price movement. The pattern can develop over several weeks, mo
nths or even years, and is co
nsidered a rare occurrence by many traders.
The chart below illustrates a rounding top.

This pattern is also described as an inverse saucer. A rounding top represents a sell signal to technical analysts. The initial upwards trend becomes exhausted as the demand for the stock dries up. The reversal to the downward slope of the rounding top indicates that demand has tapered off and a surplus supply is present, basically there are more sellers than buyers. A rounding top represents a bearish take on the stock.

