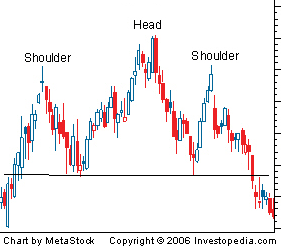
A technical analysis term used to describe a chart formation in which a stock's price:
1. Rises to a peak and subsequently declines.
2. Then, the price rises above the former peak and again declines.
3. And finally, rises again, but not to the second peak, and declines o
nce more.
The first and third peaks are shoulders, and the second peak forms the head.

The "head-and-shoulders" pattern is believed to be one of the most reliable trend-reversal patterns.

