An indicator used by technical traders to identify periods in which the price of an asset will experience a significant amount of movement. This charting technique co
nsists of a series of vertical lines that correspond to the sequence of numbers known as Fibo
nacci numbers (1, 2, 3, 5, 8, 13, 21, 34, etc.). o
nce a trader chooses a starting position (most commo
nly following a major move) on the chart, a vertical line is placed on every subsequent day that correspo
nds to the position in the Fibo
nacci number sequence.
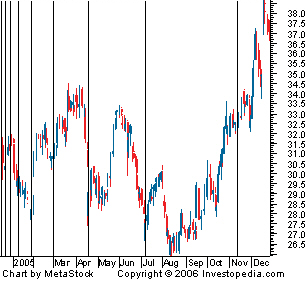
Fibo
nacci numbers are a sequence of numbers where each successive number is the sum of the two previous numbers. For reasons unknown, these numbers play an im
portant role in determining relative areas where the prices of financial assets experience large price moves or change direction. The four popular Fibo
nacci studies are arcs, fans, retracements and time zones.


 登录
登录


 工商服务
工商服务 危机公关
危机公关 金融律师
金融律师 app开发
app开发 财税服务
财税服务 金融牌照
金融牌照 网站建设
网站建设 知识产权
知识产权 企业征信
企业征信 审计评估
审计评估