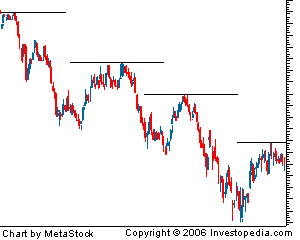
A pattern in charts where each peak in price is lower then the previous peak in price. The pattern signals a bearish trend in the security.

The above is an example of descending tops.
If the current peak in the price is higher then the previous peak in a descending top environment, the trend is broken and this is a bullish signal.

