Hi ,欢迎来到金号角网 专业金融需求撮合平台,让金融需求找到更优质的服务商

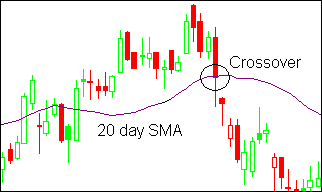
The point on a stock chart when a security and an indicator intersect. Crossovers are used by technical analysts to aid in forecasting the future movements in the price of a stock. In most technical analysis models, a crossover is a signal to either buy or sell.
Below we have a stock that falls below its 20-day moving average - a bearish sign.
