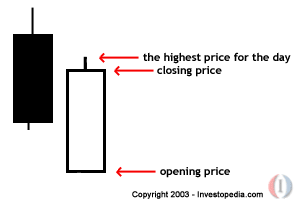
A trend in candlestick charting that occurs during a downward movement. After a stretch of bearish candlesticks, a bullish or white candlestick forms. The opening price, which becomes the low for the day, is significantly lower then the closing price. This results in a long white candlestick with a short upper shadow and no lower shadow.

The bullish belt hold often signals a reverse in investor sentiment from bearish to bullish. Since this trend occurs frequently but is often incorrect in predicting future share prices, it is rarely perceived to be useful. As with any other candlestick charting patterns, more than just two days of trading should be co
nsidered when making predictions a
bout trends.

